How to calculate it
| Drawdown | Gain needed to recover |
|---|---|
| 5% | 5.3% |
| 10% | 11.1% |
| 20% | 25.0% |
| 30% | 42.9% |
| 50% | 100.0% |
Worked through with real numbers
You start with $10,000, climb to a peak of $11,200, then a rough patch takes you to $9,856.
Notice the account is only 1.4% below where it started, yet the drawdown is 12%. Drawdown is always measured from the high, because that is money you had and gave back. The recovery table is why risk control matters so much: a 50% hole needs a 100% gain just to get level.
Where traders get it wrong
- Measuring from the starting balance. That hides drawdowns that happen after a run of profits.
- Ignoring open trades. Closed-balance drawdown can look calm while open equity is much lower. Prop firms usually count equity.
- Confusing a drawdown with a losing streak. A long run of small losers and one big loser can produce the same drawdown with very different fixes.
Tracking it in your journal
The journal draws your equity curve and reports Max Drawdown, either absolute from your starting balance or trailing from the highest point the account reached. Prop accounts track the room left to your loss limits, and the live card keeps today's daily-loss room in view.
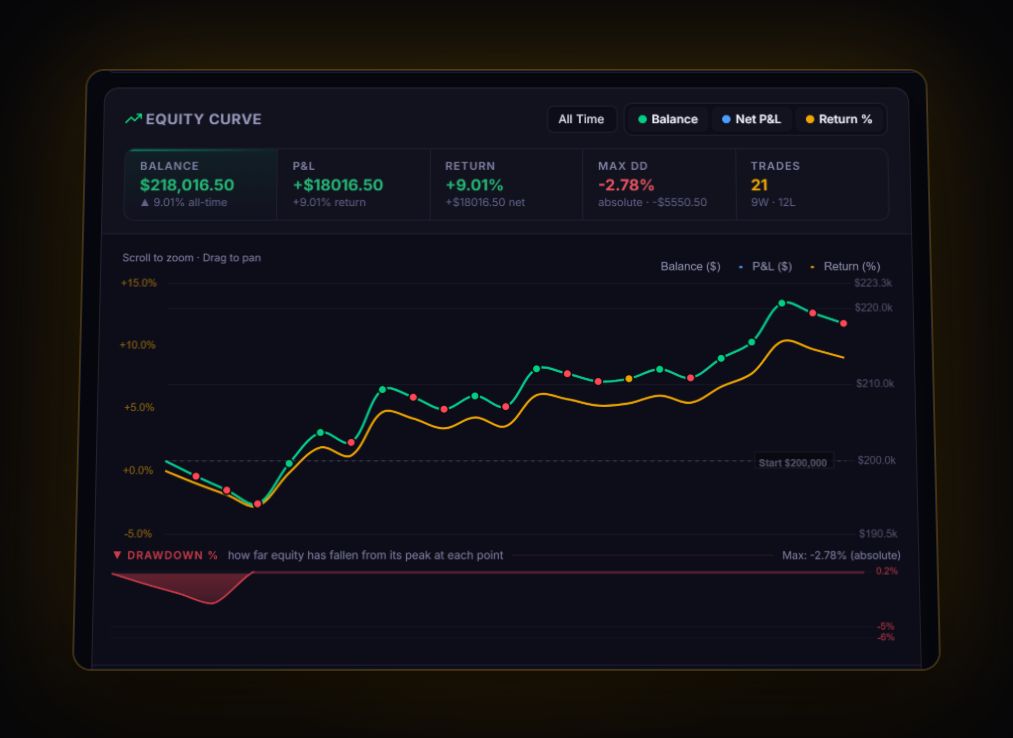
See your own Drawdown from real trades
Every figure on this page is more useful when it is yours. The free journal works it out from the trades you log or sync.
Start free, no card