The math behind it
The running peak is the highest equity reached so far. Every new high resets it.
An example with numbers
An equity series: 50,000 → 53,000 → 49,800 → 55,400 → 50,140 → 57,000.
If that year returned 18%, the Calmar ratio is 18 ÷ 9.49 = 1.90: almost two units of return for each unit of worst-case pain.
The prop meaning works differently. On a $100,000 account with a 10% static max loss, the floor is $90,000 and stays there however much profit you make. Rules vary by firm and product (static, trailing, end of day), so confirm the exact rule on your firm's site.
Mistakes to avoid
- Treating the backtest MDD as the worst case. It is the worst that has happened so far. Over a longer run, a deeper drawdown is likely.
- Using closed trades only. A trade that went −3% before closing flat never shows in a closed-trade curve, but a prop firm saw it.
- Mixing up the two meanings. Your strategy's MDD should sit well inside the firm's max loss, not near it.
What the journal does with it
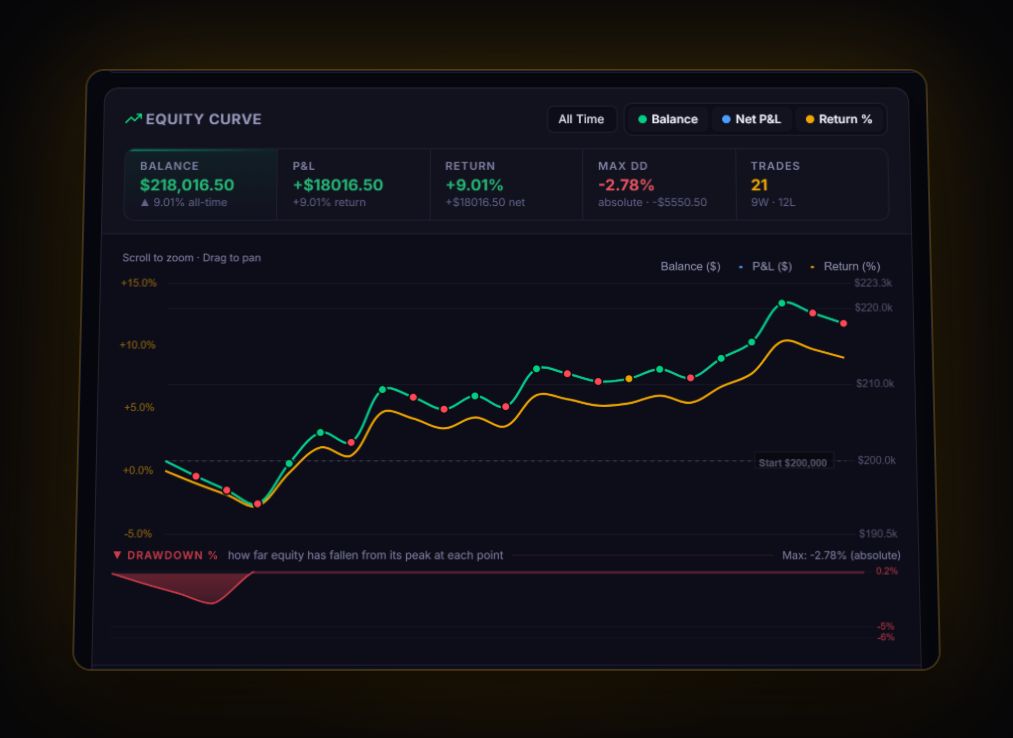
Max Drawdown is on the dashboard, measured absolute (from the starting balance) or trailing (from the highest point reached). Pro Metrics adds the Calmar Ratio. On a prop account you set the Max Drawdown % and its type, static or trailing, and the journal tracks your room to it.
See your own Max Drawdown from real trades
Stop estimating it in a spreadsheet. Log or sync your trades and the journal keeps the number current after every close.
Start free, no card