Position sizing for investors: three numbers that decide every holding
Size every holding with three numbers: how much of the portfolio you will lose if the idea is wrong (the risk budget, often 0.5% to 1.5%), the largest share of the portfolio any single holding may become (the cap, often 10% to 20%), and the total you can lose if every open idea fails at once (the heat). The share count is whichever of the first two gives the smaller position.
Last checked: 8 October 2026. Education only, not personal investment advice.
Investors often size by feel: a lot in the stocks they love, a little in the ones they are unsure of. The trouble is that conviction and correctness are different things, and the journal will show you how often they disagree. A sizing rule takes the mood out of it.
Number one: the risk budget per idea
Decide how much of the portfolio you are prepared to lose on one idea if your invalidation level is hit. Then the size falls out of the distance to that level.
shares = (portfolio × risk %) ÷ (entry − invalidation)Portfolio $80,000, risk budget 1%, so $800 per idea.
The stock is at $60. The thesis is wrong below $48, so risk per share is $12. Shares: $800 ÷ $12 = 66. Position value $3,960, about 5% of the portfolio.
Same stock, but your invalidation is the 50-week EMA at $54. Risk per share is $6, so 133 shares, worth $7,980, about 10%.
The money at risk is the same in both cases. The tighter level simply allows a bigger position. That is why the invalidation level has to be real: moving it closer to get more shares is just taking more risk with extra steps.
Number two: the cap per holding
A tight invalidation can produce a position that is too large for comfort, because a gap through your level costs more than planned. Earnings gaps are the classic case. So set a ceiling.
With a cap of 15%, no holding may exceed $12,000 at cost.
The stock is at $60 and your level is $57, only $3 away. The risk budget says $800 ÷ $3 = 266 shares, which is $15,960, or 20%. Over the cap.
Cut to the cap: $12,000 ÷ $60 = 200 shares. Actual risk is now 200 × $3 = $600, or 0.75%. Write the actual figure in the journal, not the budget. Your R for this holding is based on $600.
Number three: portfolio heat
Heat is the sum of the risk on every open position. Eight holdings at 1% each is 8% heat: if every idea hit its invalidation level, you would be down 8%. That sounds unlikely until you remember that stocks in the same sector, or all of tech, tend to fall together. Set a heat limit, for example 6% to 10%, and count closely related holdings as one larger position.
Heat also falls as you raise invalidation levels on winners. A holding whose level now sits above your entry carries no heat at all: the worst case is a smaller profit.
Why the numbers stay small
Losses compound against you. A 20% fall needs a 25% gain to recover. A 50% fall needs 100%. The drawdown recovery calculator shows the curve. Keeping each idea to around 1% and total heat under 10% means that even a very bad stretch leaves a portfolio that can recover in a normal year, rather than one that needs a miracle.
A sizing table you can copy
| Portfolio | Risk 0.5% | Risk 1% | Risk 1.5% | 15% cap |
|---|---|---|---|---|
| $20,000 | $100 | $200 | $300 | $3,000 |
| $50,000 | $250 | $500 | $750 | $7,500 |
| $80,000 | $400 | $800 | $1,200 | $12,000 |
| $150,000 | $750 | $1,500 | $2,250 | $22,500 |
Sizing inside the RB Trading journal
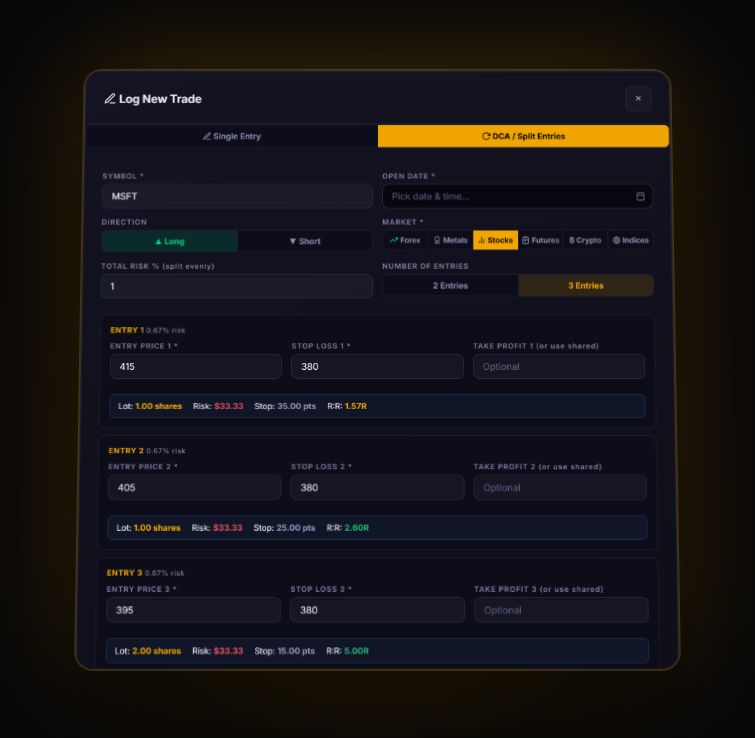
- The split-entry tab sizes for you. Set a total risk percentage, enter each price and stop, and the journal works out the size of every entry from your account balance.
- Set the account’s leverage basis to Cash, no margin (1:1) for an ordinary investing account. The journal uses it for its buying-power warning, so a position you cannot actually fund gets flagged.
- Your real R comes from the real stop. Because R is calculated from entry, stop and size, a capped position like the one above shows its true risk, not the budget you started with.
- Drawdown is tracked on the equity curve, and on a personal account the journal only draws a drawdown limit line if you set one yourself.
For a quick one-off figure, the position size calculator does the same arithmetic in a browser tab.
Sizing questions
What percentage of my portfolio should I risk per stock?
Many investors use between 0.5% and 1.5% of the portfolio per idea, measured as the loss if the invalidation level is hit. The exact figure matters less than using the same rule every time.
What is the difference between position size and risk?
Position size is how much you buy. Risk is how much you lose if you are wrong. A $10,000 position with an exit 5% below entry risks $500. The same position with an exit 20% below risks $2,000.
What is portfolio heat?
The total of the risk on every open position. If eight holdings each risk 1%, heat is 8%, the loss if every idea failed at once.
Track it in a journal that does the maths
Log the trade once. R, fees and the weighted average entry are worked out for you.
Start free, no card