What a Monte Carlo simulation actually tells you
Your backtest or journal gives you one sequence of trades. That sequence is a single draw from all the orders those wins and losses could have come in. A Monte Carlo simulation keeps your statistics (win rate, average win, average loss) and reshuffles luck thousands of times, so you see the whole spread of outcomes the same edge can produce.
The point is not to predict your next 200 trades. It is to stop being surprised by them. If the simulation says one run in five hits a 10% drawdown, then a 10% drawdown is not evidence your strategy broke. It is a normal Tuesday for that strategy, and you can plan for it before it happens.
How this simulator works
Each run starts at your balance and plays the number of trades you set. On every trade a seeded random number decides win or loss using your win rate. A win adds your average win in R, a loss subtracts your average loss in R, where 1R is your risk per trade in dollars.
- Fixed sizing risks the same dollar amount every trade: your risk % of the starting balance. This is how most prop traders size, because the firm's limits are set in dollars from the initial balance.
- Compounding sizing risks your % of the current balance, so bets grow after wins and shrink after losses.
- The drawdown for each run is measured from its own running peak to its lowest point after that peak, on closed-trade balance.
- The seed fixes the random sequence. Change it to see a different set of runs. If the headline numbers barely move between seeds, you have enough runs.
It is a deliberately simple model: every win is the same size and every loss is the same size, and trades are independent. Real trading has variable winners, streaky markets and costs. Use net figures from your journal (after commission, spread and slippage) and treat the output as a range, not a promise.
A worked example
Take a strategy with a 45% win rate, winners averaging +2R and losers −1R, traded at 1% fixed risk on a $10,000 account for 200 trades. Those are the default inputs above.
So the middle of the distribution sits near +70R and roughly two thirds of runs land within about 21R of it. The unlucky 5th percentile is around 70 − 1.645 × 21, or +35R: still a winning account, but half the result of the median trader using exactly the same rules. Run the simulator and you will see the same shape.
Now look at drawdown. Even with a solid +0.35R edge, about one run in five touches a 10% drawdown at some point (20% with the default seed of 42). If you are on a prop account with a 10% max loss, that share is the part of your future that fails the account. Halve the risk to 0.5% and that figure drops to under 1%, while the median result only halves. That trade-off, smaller growth for much better survival, is the most important thing this tool shows.
How to read the results
- Median final balance is the typical outcome. Half the runs did better, half worse.
- 5th and 95th percentiles are the unlucky and lucky edges. Plan around the 5th, not the median.
- Runs that hit the drawdown is the share of runs whose deepest drawdown reached your test level. Set it to your prop firm's max loss, or to the drawdown that would make you quit.
- Max drawdown, worst 5% is how deep the bad runs got. Your live drawdown will probably be deeper than your backtest showed, and this number is a fairer guide.
Where your inputs should come from
The simulator is only as honest as the numbers you give it. A win rate from 30 trades can easily be ten points off the truth, and a simulation built on it will look precise while being wrong. Use at least 50 to 100 trades of one setup, measured net of costs. The win rate, average win and loss in R and expectancy pages explain each input, and the RB journal calculates all of them from your own trades, along with max drawdown and your longest losing streak to compare against the simulation.
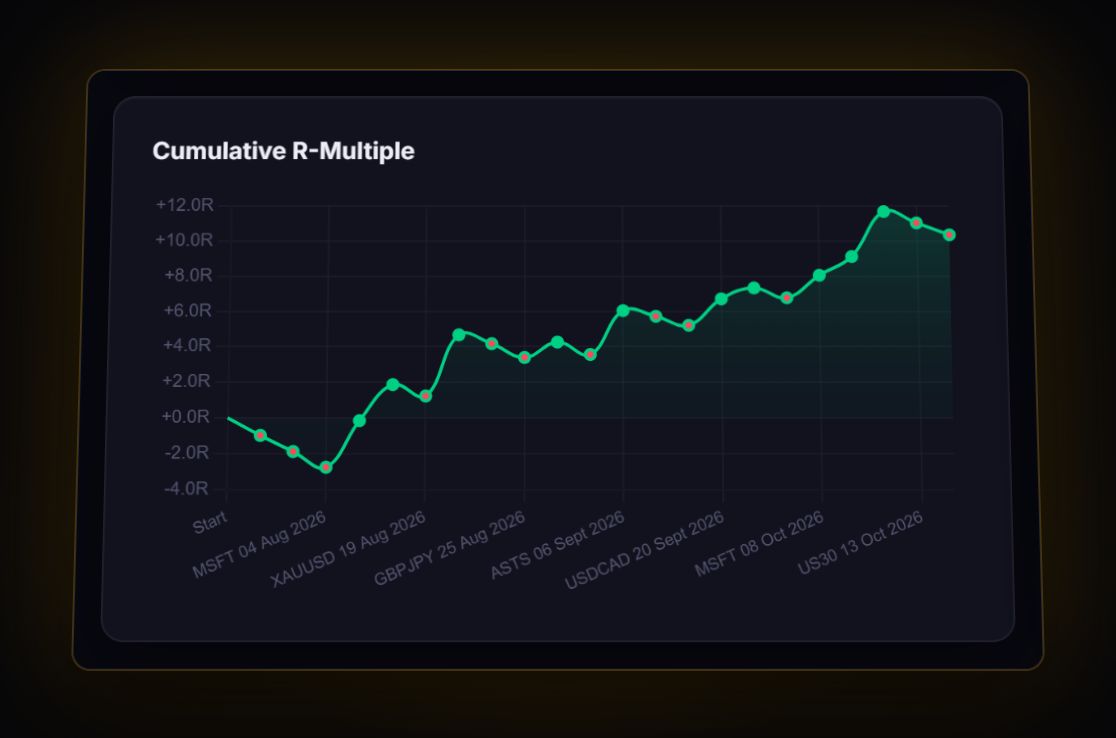
If you want a single probability rather than a fan of paths, the risk of ruin calculator gives the formula answer for hitting a loss level, and the prop firm drawdown calculator shows your exact floors today.
Run it on your real numbers
The journal works out your win rate, average win and loss in R, expectancy and max drawdown from the trades you log, import or live-sync from MT4, MT5 and cTrader, so the simulation starts from facts.
Start free, no cardFAQ
Frequently asked questions
What is a Monte Carlo simulation in trading?
It takes your strategy statistics, such as win rate and average win and loss in R, and replays them in thousands of random orders. The result is a range of possible equity curves and drawdowns for the same edge, so you can see how much of any single result is luck.
How many runs do I need?
Enough that the headline numbers stop moving when you change the seed. For most inputs, 1,000 runs is plenty to read percentiles and drawdown odds to within a point or two. Use 5,000 if you are looking at rare events such as a deep drawdown.
Why use a seed?
A seed fixes the random sequence, so the same inputs always produce the same output. That lets you change one input, such as risk per trade, and see its effect without the noise of a fresh random draw. Click New seed to check the result is stable.
Does the simulator include costs and slippage?
Only if your inputs do. Enter average win and loss in R after commission, spread and slippage, which is how the RB journal reports them for synced and fully logged trades.