The math behind it
The inputs must be returns over equal time periods (days, weeks, months). That is why annualising needs care: √252 only applies to daily returns.
An example with numbers
Over 21 trading days your account returns an average of 0.12% a day with a standard deviation of 0.80%.
The daily risk-free figure is 4% ÷ 252 = 0.0159% a day. A month is also a tiny sample: one more volatile week could halve the number, so treat a 21 day Sharpe as a rough read, not a grade.
Mistakes to avoid
- Annualising a per-trade Sharpe with √252. Trades are not days. If you take 3 trades a day or 3 a week, the scaling is completely different.
- Punishing good volatility. Sharpe counts a big winning day as "risk". The Sortino ratio uses only downside deviation and suits trend strategies better.
- Short samples. A few weeks of data can produce Sharpe values that never repeat.
- Assuming normal returns. Strategies that sell options or fade moves can show a high Sharpe right up to a large loss.
What the journal does with it
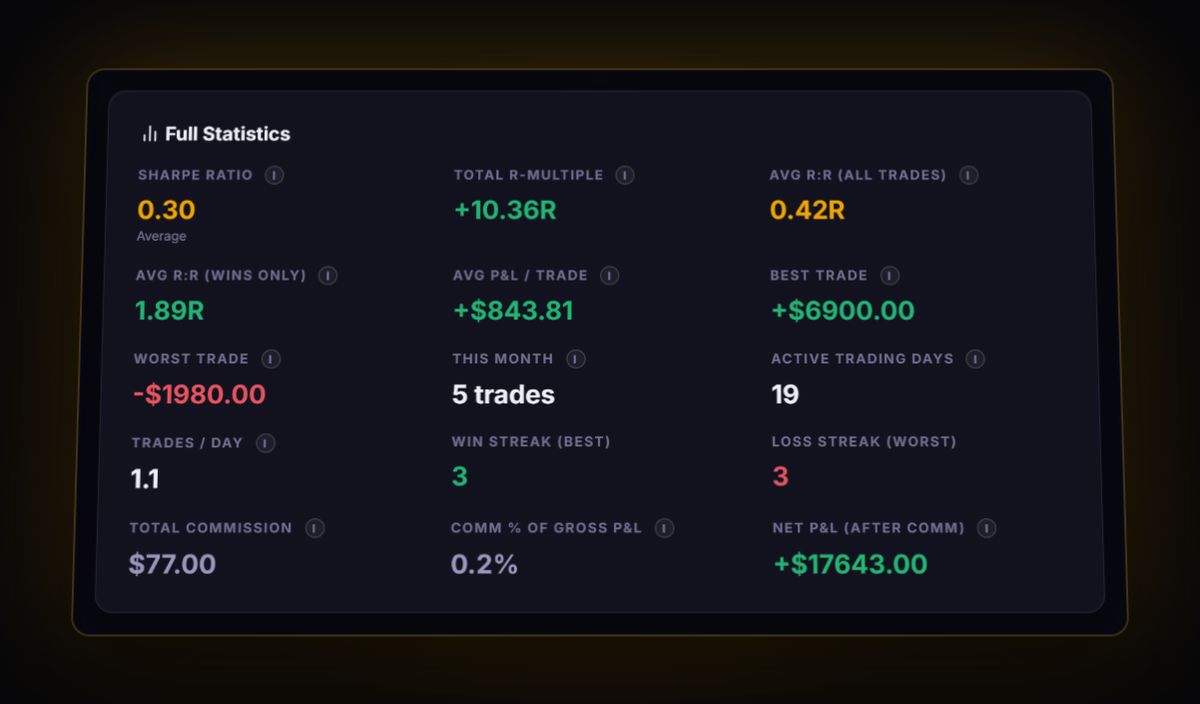
The journal's Sharpe Ratio is calculated per trade: average trade P&L ÷ standard deviation of trade P&L. It is not annualised, so compare it with your own past months rather than with a fund's published figure. Pro Metrics adds the Sortino Ratio (mean return ÷ downside deviation) and the Calmar Ratio (annualised return ÷ max drawdown).
See your own Sharpe Ratio from real trades
Stop estimating it in a spreadsheet. Log or sync your trades and the journal keeps the number current after every close.
Start free, no card