How to calculate it
Reported as a negative R, e.g. −0.4R means the trade went 40% of the way to the stop at its worst.
Worked through with real numbers
Ten winning trades of one setup, all with a 20 pip stop, had these worst points before they worked:
Nine of ten winners never went past −0.4R. Only one used most of the stop. Two readings follow. First, entries are well timed: price usually moves your way quickly. Second, a stop at about −0.5R (10 pips) would have kept nine of these ten winners and halved the loss on every losing trade. Before acting on that, check the losers too and test it on 50 or more trades, because one setup's MAE can change with volatility.
Where traders get it wrong
- Tightening the stop from a handful of trades. MAE needs a decent sample before it can move a stop.
- Ignoring volatility. A stop set from calm-month MAE gets clipped when ATR expands.
- Measuring on closes only. MAE needs the intrabar extreme, not the candle close.
Tracking it in your journal
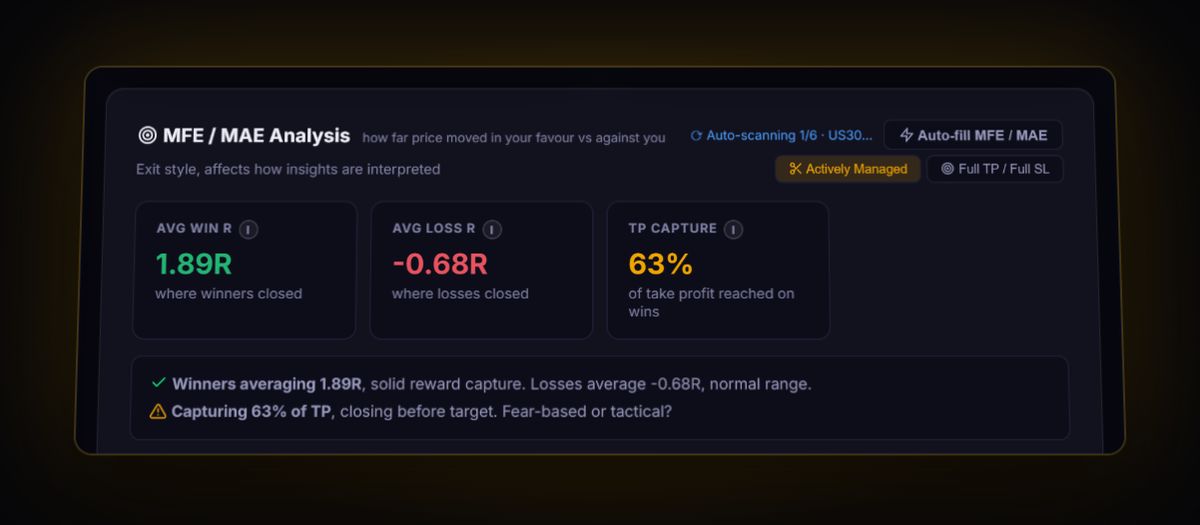
The journal reports Avg MAE in R, a MAE Distribution histogram, and SL Drawdown on Winners: MAE ÷ stop distance on trades that eventually won, which shows how much of the stop your winners typically used.
See your own MAE from real trades
Every figure on this page is more useful when it is yours. The free journal works it out from the trades you log or sync.
Start free, no card