The math behind it
Capture of 100% means you sold the exact top of the trade. Nobody does that consistently, so the useful question is how far below it you usually are.
An example with numbers
Eight winners from a breakout setup:
| Exit R | MFE | Capture |
|---|---|---|
| +1.0 | +2.6 | 38% |
| +1.2 | +3.1 | 39% |
| +0.8 | +1.4 | 57% |
| +1.5 | +4.0 | 38% |
| +1.0 | +1.2 | 83% |
| +1.3 | +2.9 | 45% |
| +0.9 | +2.2 | 41% |
| +1.1 | +2.4 | 46% |
Average exit is +1.10R, average MFE is +2.48R. You are banking well under half of the typical move. A fixed 2R target would have filled on six of the eight (every trade whose MFE reached 2R), for +12R, plus +1.8R from the two that fell short and closed where they did: +13.8R against the +8.8R actually taken. Test the change on a larger sample before you trust it, and remember a higher target can turn some winners into losers.
Mistakes to avoid
- Expecting to capture all of it. MFE is hindsight. The aim is a better average, not the top tick.
- Looking at winners only. Losers that were +1.5R before they turned are the strongest case for a partial exit or a trailing stop.
- Changing exits after one great runner. Decide from the distribution, not the best trade.
What the journal does with it
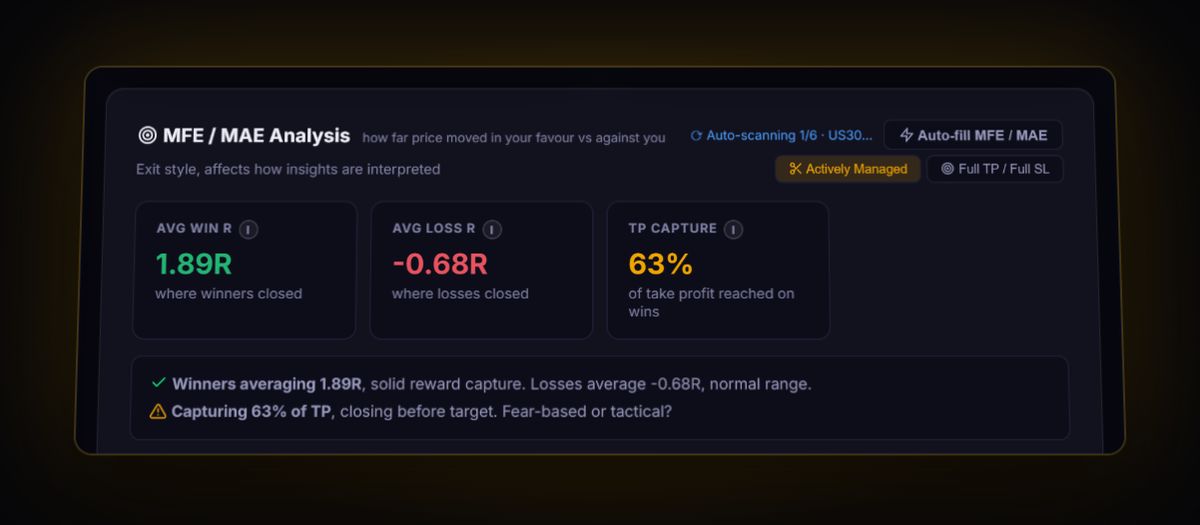
The journal shows Avg MFE in R next to Avg Win R, a Win Exit Distribution histogram of where winners closed, and TP Capture %, the share of the distance to your take-profit that winning trades actually captured.
See your own MFE from real trades
Stop estimating it in a spreadsheet. Log or sync your trades and the journal keeps the number current after every close.
Start free, no card