The math behind it
Stop-market orders become market orders when touched, so they always fill but can slip. Stop-limit orders cap the fill price but may not fill at all in a fast gap, which leaves you in the trade.
An example with numbers
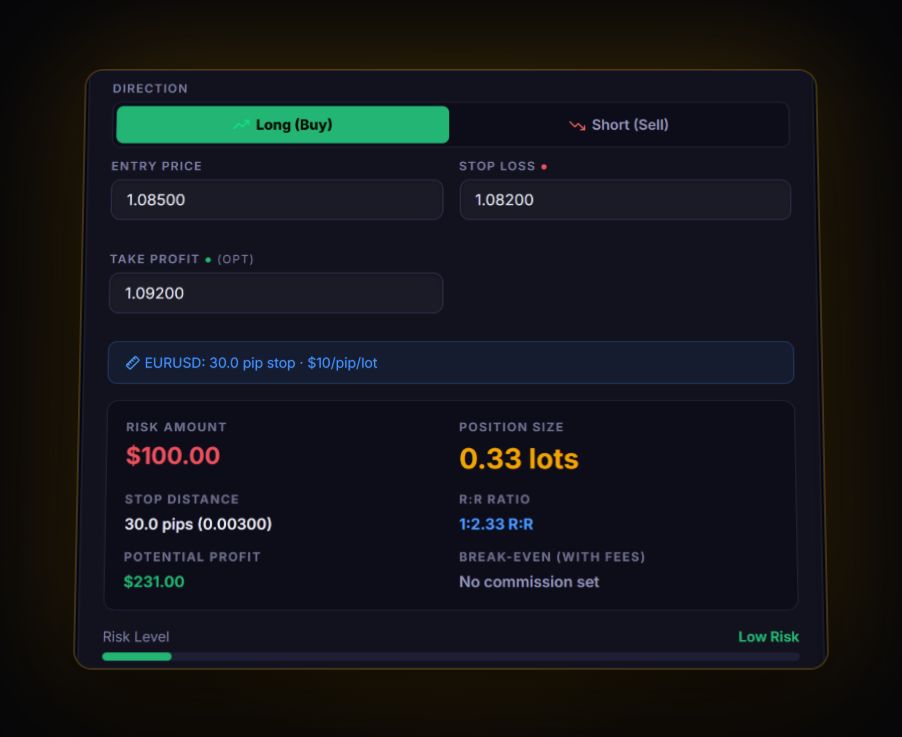
A long at $182.40 with the stop under a swing low at $179.90: $2.50 a share. With 120 shares, 1R is $300.
Now check the stop against volatility. If the stock's 14-day ATR is $3.10, the stop is only 0.8 ATR away, inside a normal day's range. Ordinary noise can take it out before the idea plays out. Widening it to about 1.5 ATR ($4.65) and cutting size to 64 shares keeps 1R near $300 while giving the trade room.
Mistakes to avoid
- Moving the stop further away. It turns a −1R loss into −2R and breaks every stat built on R.
- Stops at obvious round numbers. Everyone's stop sits at the same place, and price often tags it.
- Stops tighter than the noise. Measure against ATR before you place it.
- Mental stops. They are easy to skip when it counts. If it is not on the server, it is a hope.
What the journal does with it
R needs a stop, so the journal reads it from every synced or logged trade and calculates R from it. MAE shows how far trades went against you in R, and SL Drawdown on Winners (MAE ÷ stop distance on winning trades) tells you whether your winners usually go close to the stop, a sign of early entries, or barely touch it, a sign the stop could be tighter.
See your own Stop-Loss from real trades
Stop estimating it in a spreadsheet. Log or sync your trades and the journal keeps the number current after every close.
Start free, no card