The formula
The stop in the formula is always the initial stop, the one you sized the trade from. If you trail it later, the trade's R still comes from the original distance.
A worked example
Three trades from one week, in three different markets:
| Trade | Entry / stop / exit | Risk | Result | R |
|---|---|---|---|---|
| EUR/USD long | 1.0850 / 1.0820 / 1.0925 | 30 pips | +75 pips | +2.50R |
| Nasdaq short | 18,400 / 18,460 / 18,430 | 60 pts | −30 pts | −0.50R |
| Stock long | $200 risked | $200 | +$300 | +1.50R |
Total: +3.5R over three trades, an average of +1.17R. Notice the short lost money but only half a unit, because it was cut before the stop. In dollars these three trades would be impossible to compare if they were sized differently. In R they add up cleanly.
Common mistakes
- Measuring from a moved stop. If you tighten the stop to break-even and then get taken out, that is a 0R trade measured from the original risk, not a "−1R" on a new, tiny risk.
- Ignoring costs. A +2R target that pays 0.15R in spread and commission is really +1.85R. Net R is what your account sees.
- Trades with no stop. Without a stop there is no 1R, so the trade cannot be measured. That is a risk problem first and a journaling problem second.
- Averaging dollars instead. If your size grew over the year, dollar averages flatter recent trades. R does not care.
How the RB journal tracks it
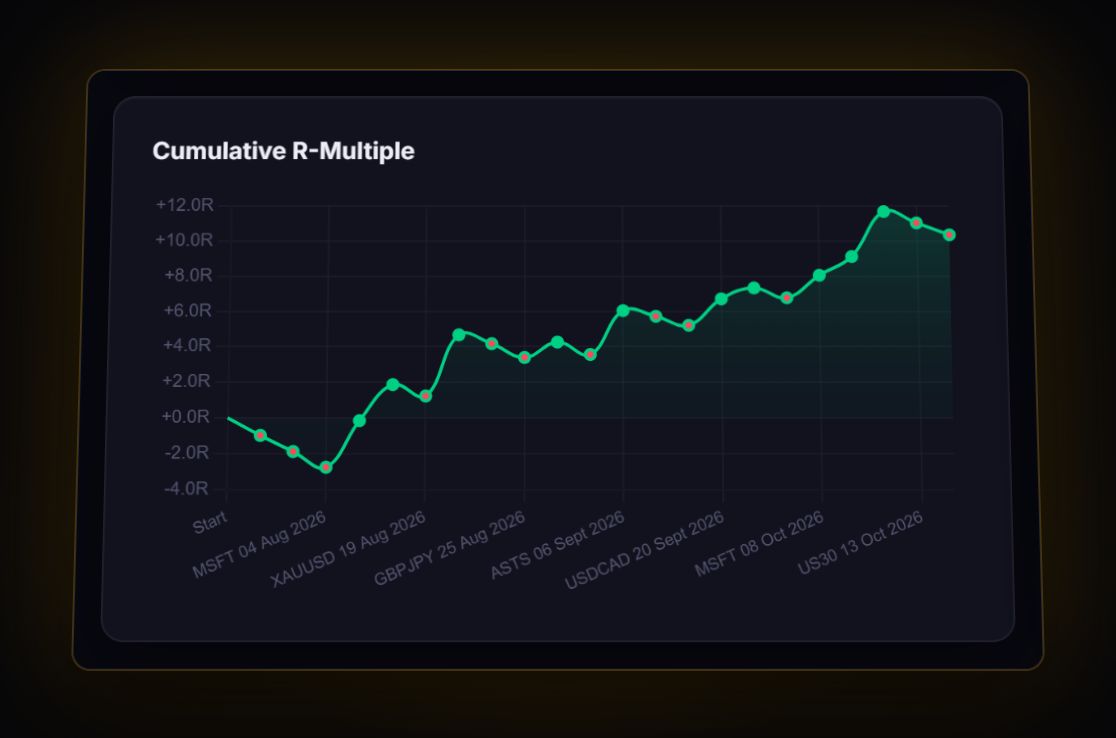
The RB journal calculates R on every trade that has an entry, a stop and an exit. From those it builds Avg Win R, Avg Loss R, Expectancy (R), Total R-Multiple and an R-multiple distribution, and it reports excursions (MAE and MFE) in R too. Synced MT4, MT5 and cTrader trades arrive with their stop, so R appears without typing anything.
See your own R-Multiple from real trades
Log trades by hand, import a file, or live-sync MT4, MT5 and cTrader through the RBSync EA. The numbers on this page then come from your own history instead of examples.
Start free, no card