The DCA journal: track every buy and know your real average cost
A dollar-cost averaging journal records every scheduled buy with its date, price, amount and fee, then gives you one number that matters: the average cost of everything you hold. Because you buy more units when the price is low, that average lands below the plain average of the prices you paid. The journal is how you prove the plan is working, and how you notice when you stopped following it.
Last checked: 8 October 2026. Education only, not personal investment advice.
DCA sounds too simple to need a journal. Buy the same amount every month, ignore the noise. In practice people skip the month after a big drop, double up after a big rally, and switch assets halfway. A log of every buy shows you exactly where the plan bent, and what that cost.
The maths, with six monthly buys
You invest $500 on the first of each month for six months. The prices on those days are $50, $40, $25, $40, $50, $55.
| Month | Price | Amount | Units bought |
|---|---|---|---|
| 1 | $50 | $500 | 10.00 |
| 2 | $40 | $500 | 12.50 |
| 3 | $25 | $500 | 20.00 |
| 4 | $40 | $500 | 12.50 |
| 5 | $50 | $500 | 10.00 |
| 6 | $55 | $500 | 9.09 |
| Total | $3,000 | 74.09 |
Average cost is $3,000 ÷ 74.09 = $40.49. The plain average of the six prices is $260 ÷ 6 = $43.33. The gap is the whole point of DCA: the $25 month bought twice as many units as the $50 months.
At $55 the holding is worth 74.09 × $55 = $4,075, a gain of $1,075 or 35.8%.
Be honest about the comparison. If you had put all $3,000 in at month one, you would hold 60 units worth $3,300, a 10% gain. DCA won here because the price fell and recovered. In a market that only rises, the lump sum wins, because more money is invested for longer. DCA is a way to control regret and timing risk, not a way to beat the market. Your journal should show which world you were in.
Fees decide whether small buys make sense
A flat fee hurts small purchases more than large ones. A $2.50 fee on a $100 buy is 2.5% gone before the price moves. On a $500 buy it is 0.5%. Log the fee on every buy and add it to cost. If fees over a year are more than about 1% of what you invested, buy less often in larger amounts.
When you sell part: FIFO versus average cost
This is where most DCA spreadsheets go wrong. When you sell some units, your realised profit depends on which units you say you sold.
From the plan above you sell 30 units at $55, for $1,650.
FIFO (first in, first out) treats the oldest units as sold: 10 at $50, 12.5 at $40, 7.5 at $25. Cost $1,187.50, realised profit $462.50.
Average cost uses $40.49 per unit. Cost $1,214.72, realised profit $435.28.
Same sale, $27 of difference. Which method applies for tax depends on your country and account type, so check with a tax adviser. For judging the plan, pick one and stay with it.
What to write next to each buy
- Date, price, amount, units, fee. The minimum.
- On plan or off plan. One word. Off plan means you changed the amount, the date or the asset.
- If off plan, one line on why. After a year these lines are the most useful part of the journal. They show whether your deviations helped or hurt.
How to track a DCA plan in the RB Trading journal
There are two ways, depending on the kind of DCA you run.
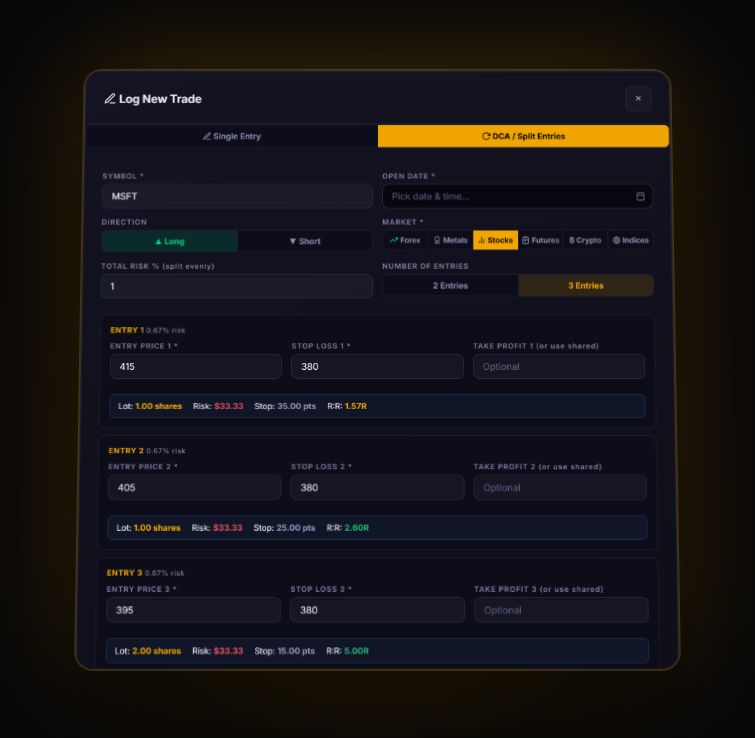
A planned set of two or three entries
The DCA / Split Entries tab on Add Trade takes two or three entries for one symbol. Each entry has its own price and stop, the total risk percentage you set is split evenly between them, and the journal sizes each entry from your balance. They save as one group, so your stats count it as one position with a size-weighted R. This suits investors who buy in thirds around planned levels. The full walk-through is in tracking a position you scale into.
An open-ended monthly plan
Give the plan its own account in the journal and log each buy as a trade with the same strategy tag, for example "BTC monthly". Filtering by that tag shows the plan on its own. If the buys come from a crypto exchange, import the fill export: the journal pairs buys and sells first in, first out, and buys with no matching sell show as your current open position. That is the FIFO view from the example above.
R needs an exit level. If your DCA plan has none, judge it on cost basis and return rather than R, and write down in advance what would make you stop the plan.
DCA journal questions
Why is my DCA average cost lower than the average price?
Because a fixed amount buys more units when the price is low and fewer when it is high. The cheap months carry more weight, so your cost per unit sits below the simple average of the prices.
Does dollar-cost averaging beat investing a lump sum?
Not reliably. In a market that keeps rising, a lump sum usually ends ahead because the money is invested for longer. DCA helps most when prices fall and recover during the buying period, and it reduces the regret of bad timing.
Should I record fees in a DCA journal?
Yes, on every buy, and add them to your cost. Flat fees on small buys can quietly cost several percent a year.
Track it in a journal that does the maths
Log the trade once. R, fees and the weighted average entry are worked out for you.
Start free, no card