A quarterly portfolio review you can finish in ninety minutes
Once a quarter, open every holding’s journal entry and answer four questions: is the thesis still true, what state is the trend in, has the position outgrown its cap, and should the invalidation level move. Then step back for three portfolio checks: total heat, concentration and off-plan buys. Finish with one number from your closed positions, expectancy in R. Write one line per holding. Ninety minutes, four times a year.
Last checked: 8 October 2026. Education only, not personal investment advice.
Investors review too often or not at all. Checking prices daily invites trades you did not plan. Never reviewing lets a broken thesis sit in the portfolio for years. A fixed quarterly slot, ideally after most of your holdings have reported earnings, is the middle path.
Part one: four questions per holding
- Is the thesis still true? Reread what you wrote at entry, not what you remember. Answer yes, weaker or broken. Broken means you sell, whatever the price is doing.
- What is the trend state? Uptrend, pullback or downtrend on the 50/200 EMA filter. This decides whether new money is allowed in.
- Has it outgrown its cap? Winners grow. A holding bought at 10% of the portfolio can drift far past the cap you set.
- Should the invalidation level move? Raising it locks in part of a gain and cuts heat. Lowering it needs a written reason, and usually there is not a good one.
Portfolio $100,000. One holding was bought for $10,000 and is now worth $22,000, so 22% of the portfolio. Your cap is 15%.
Bringing it back to the cap means selling $7,000. Trimming to 18% means selling $4,000. Neither answer is wrong. The point is that you decide on purpose, write the reason in the entry, and log the trim as a partial exit.
Meanwhile its invalidation level was 20% below the original entry. The trend has carried the 50-week EMA to 35% above entry. Moving the level up to that EMA means the worst case on this holding is now a gain, and it drops out of your heat total.
Part two: three checks on the whole portfolio
Heat
Add up the money you would lose if every holding hit its invalidation level today, then divide by the portfolio value. If raising levels on winners has cut it to 4%, you have room for new ideas. If adds have pushed it to 14%, the next buy waits.
Concentration
Group holdings that move together: one sector, one theme, one country. Three 8% positions in chip makers are one 24% position for practical purposes.
Off-plan buys
Count the buys this quarter that were not in a written plan. Then compare their results with the planned ones. This is the check people skip, and it is usually the most useful.
Part three: one number from closed positions
Expectancy tells you what an average decision is worth. In R it is the average result of every closed position.
Over the last twelve months you closed 12 positions: 5 winners averaging +2.4R and 7 losers averaging −0.8R.
Expectancy: (5 × 2.4 − 7 × 0.8) ÷ 12 = (12.0 − 5.6) ÷ 12 = +0.53R per position.
You were wrong more often than right, 5 out of 12, and the process still paid about half of a risk unit per decision. That is what keeping losses near −1R and letting winners run looks like. If your average loser were −1.6R because levels kept moving lower, the same record would be (12.0 − 11.2) ÷ 12 = +0.07R, close to nothing.
The review page
Keep it to one line per holding and a short block for the portfolio. Something like this:
| Holding | Thesis | Trend | Weight / cap | Level | Action |
|---|---|---|---|---|---|
| Holding A | Yes | Uptrend | 22% / 15% | Raised to 50w EMA | Trim $4,000 |
| Holding B | Weaker | Pullback | 8% / 15% | Unchanged | Hold, no adds |
| Holding C | Broken | Downtrend | 6% / 15% | n/a | Sell |
Running the review from the RB Trading journal
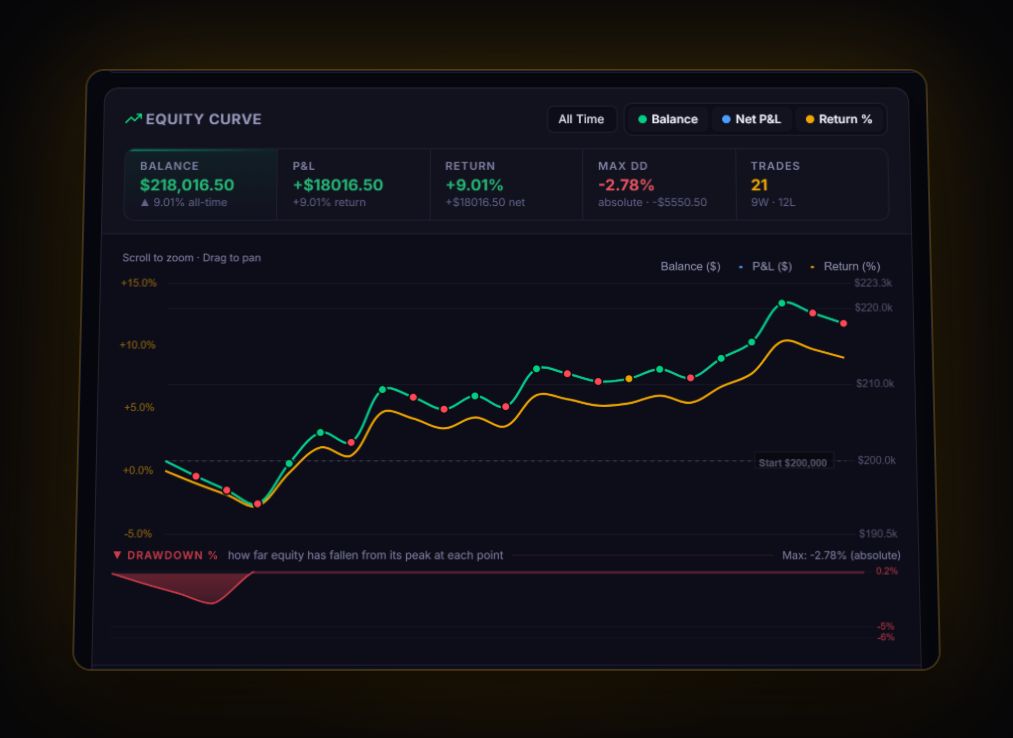
- Open the long-term account on its own, so swing trades and prop accounts do not distort the numbers. Use All Accounts afterwards for the combined view.
- Expectancy, win rate and average win and loss in R are on the dashboard for whichever account and date range you pick.
- Filter by strategy tag to compare approaches, for example "Core hold" against "Dividend", or "Uptrend" entries against "Pullback" entries.
- Hold-time analysis shows whether your longest holds are your best or just your stubbornest, once you log close dates.
- Trims are partial exits. The journal records them against the same position, and the final R is size-weighted across every exit on the risk taken at entry.
- Write the review line in the trade notes, dated, so next quarter starts by reading what you decided last time.
Review questions
How often should a long-term investor review their portfolio?
Once a quarter suits most people, ideally after the bulk of your holdings have reported earnings. Add an extra review only when something breaks a thesis or a holding hits its invalidation level.
What is expectancy in investing?
The average result per closed position, usually measured in R. Twelve positions with five winners at +2.4R and seven losers at -0.8R give an expectancy of about +0.53R.
Should I rebalance a winner that has grown past my cap?
Decide on purpose rather than by default. Trimming back to the cap reduces concentration. Holding is fine too if you raise the invalidation level and record why.
Track it in a journal that does the maths
Log the trade once. R, fees and the weighted average entry are worked out for you.
Start free, no card