How to journal trims and exits, the decisions investors skip
Log every sale against the original position, with the price, the share count and one of a few fixed exit reasons. Measure the finished position in R across all the exits together, weighted by how many shares each exit closed. Then once a year, check the price three months after each exit. That last step is the one that teaches you whether your selling adds value.
Last checked: 8 October 2026. Education only, not personal investment advice.
Investors write long notes about why they bought and almost nothing about why they sold. Yet the sell decision decides the result just as much. A great entry sold in a panic is a mediocre trade. An average entry held through the right trend is a great one.
Five exit reasons, and only five
Free-text reasons are impossible to review later. Pick from a short list and add a sentence of detail if you want.
| Reason | Meaning |
|---|---|
| Invalidation | The level you wrote at entry was hit. |
| Thesis broken | The business reason failed, whatever the price did. |
| Rebalance | The holding grew past its cap and you trimmed it back. |
| Target | A planned price or valuation was reached. |
| Discretionary | None of the above. Fear, a better idea, a need for cash. |
After a year the counts alone are revealing. If most of your sales sit in "Discretionary", your selling is not following a plan, and the post-exit check below will show what that costs.
Measuring a position you sold in pieces
You bought 200 shares at $50 with an invalidation level at $44. Risk per share is $6, so 1R is 200 × $6 = $1,200.
| Exit | Shares | Price | Profit | R on those shares |
|---|---|---|---|---|
| Trim 1 (Rebalance) | 50 | $62 | $600 | +2.00R |
| Trim 2 (Target) | 50 | $70 | $1,000 | +3.33R |
| Final (Invalidation, raised) | 100 | $58 | $800 | +1.33R |
Total profit $2,400 on $1,200 of initial risk is +2.00R.
The same answer, weighted by shares: 0.25 × 2.00 + 0.25 × 3.33 + 0.50 × 1.33 = 2.00R.
If you had only logged the final exit, you would record +1.33R and conclude the position was ordinary. If you averaged the three R figures without weighting, you would get 2.22R and flatter yourself. Neither is the real result.
The post-exit check
Once a year, look up the price of every stock you sold three months after the sale. Record it next to the exit. Then group by exit reason.
You sold Holding X at $58 for "Discretionary". Three months later it trades at $71. On 100 shares that is $1,300 left on the table, or 1.08R against the original $1,200 risk.
You sold Holding Y at $31 on "Thesis broken". Three months later it is $24. On 150 shares the sale saved $1,050.
One check proves nothing. Twenty of them, grouped by reason, usually show a clear pattern: rule-based exits save money on average, and discretionary ones are a coin flip at best. That is the evidence that makes it easier to follow the rule next time.
Trims are not failures of conviction
Trimming a winner that has grown to 25% of your portfolio feels like betting against your best idea. It is not. It is limiting how much one idea can hurt you. Write the trim as a rebalance and keep the rest of the position on its plan. Your journal will show the remaining shares still riding the trend.
Write the exit plan before the entry
The easiest exits to journal are the ones you decided in advance. When you open a position, add two lines under the thesis: where you would trim (a price, a weight, or both) and what would make you sell everything. For example: "Trim a quarter at 2R or if the holding passes 15% of the portfolio. Sell the rest on a weekly close below the 50-week EMA, or if the thesis breaks." Then each exit later is either following that plan or departing from it, and the journal entry says which. Departures are allowed. Unrecorded departures are how a plan quietly stops existing.
Logging exits in the RB Trading journal
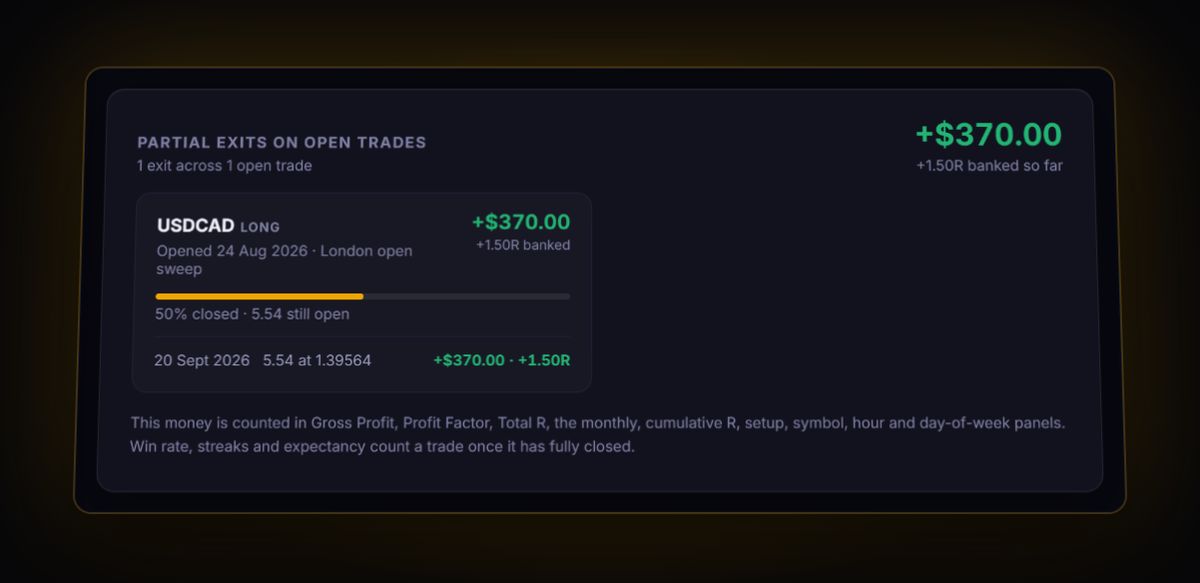
- Partial exits stay on one position. The journal records each partial close against the original trade instead of creating a new one, so your stats count one position, not three.
- R is size-weighted automatically. The final R is calculated across every exit on the risk taken at entry, the 2.00R from the example, not the last leg on its own.
- Use the notes for the exit reason and the three-month check, dated, so the whole story of the position reads top to bottom.
- Screenshots attached at each exit show what the chart looked like when you decided, which beats memory every time.
Exit questions
How do I calculate R when I sell a position in several parts?
Add up the profit from every sale and divide by the risk you took at entry. In the example, $2,400 of profit on $1,200 of risk is 2.00R. Weighting each exit's R by its share of the position gives the same answer.
Should a trim be logged as a separate trade?
No. Log it as a partial exit of the original position. Splitting it into separate trades breaks your win rate and your R figures.
How do I know if my selling decisions are any good?
Record the price three months after each sale and group the results by exit reason. After twenty or so exits you will see which reasons save money and which leave it on the table.
Track it in a journal that does the maths
Log the trade once. R, fees and the weighted average entry are worked out for you.
Start free, no card