How to calculate it
The two versions give the same answer. The second one, the plain average of every trade's R, is easier when your winners and losers vary a lot in size.
Worked through with real numbers
Take a sample of 120 trades: 50 winners averaging +1.8R and 70 losers averaging −0.9R (some losers were cut before the stop).
Win rate is only 41.7%, yet the strategy earns about a quarter of a unit of risk every time it trades. At 1% risk per trade that is roughly +22.5% of starting equity per 100 trades, before compounding.
Now add costs. If spread and commission take 0.05R per trade, expectancy drops to +0.175R, a 22% cut to the edge. A scalper with a tight stop pays a bigger share of each R in costs than a swing trader, so the same broker can be fine for one and fatal for the other.
Where traders get it wrong
- Trusting 20 trades. A short sample can show +0.5R by luck. Wait for 50 to 100 trades of one setup before you lean on the number.
- Blending setups. One strong setup and one losing one average out to "slightly positive". Split expectancy by setup and drop the loser.
- Leaving out costs. Expectancy before commission is a backtest number. Use net figures.
- Confusing win rate with edge. A 70% win rate with small winners can carry negative expectancy. Only the full formula tells you.
Tracking it in your journal
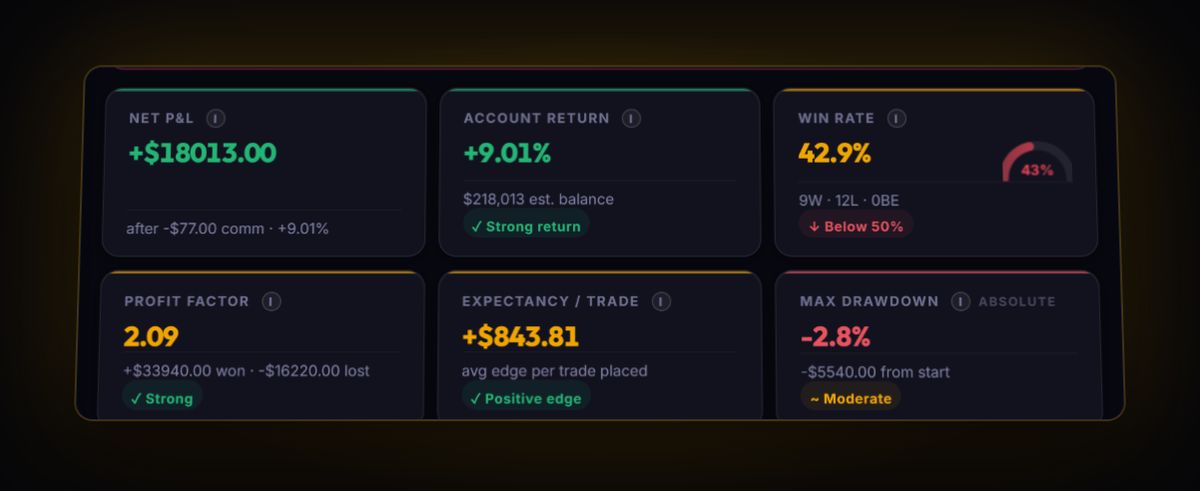
The dashboard shows Expectancy (R), the mean of your signed R-multiples, and Expectancy Per Trade in money. Tag trades by setup and the journal breaks the stats down per setup, including a Profit Factor by Setup panel, so you can see which idea is carrying the account. Pro Metrics adds SQN, which scales expectancy by its consistency and sample size.
See your own Expectancy from real trades
Every figure on this page is more useful when it is yours. The free journal works it out from the trades you log or sync.
Start free, no card