The math behind it
Profit factor and expectancy always agree on direction: PF above 1 means positive expectancy. Profit factor tells you the ratio, expectancy tells you the size per trade.
An example with numbers
A month of 22 trades: 9 winners totalling $4,140 and 13 losers totalling $2,860.
Now take out the single best trade, a $900 winner on a news spike:
One trade moved the month from "solid" to "barely working". That is the most useful test you can run on any profit factor: remove the top one or two winners and see what is left. If the edge disappears, you are relying on outliers.
Mistakes to avoid
- Small samples. With fewer than about 30 trades a single result swings profit factor wildly, as the example shows.
- Gross instead of net. Commissions and swaps belong in the losing side. A PF of 1.2 before costs can be 1.0 after them.
- An "infinite" PF. Ten winners and no losers gives a division by zero, not a great strategy. It usually means stops are not being taken.
- Comparing across styles. A scalper and a trend follower can share a PF of 1.6 with completely different drawdowns and trade counts.
What the journal does with it
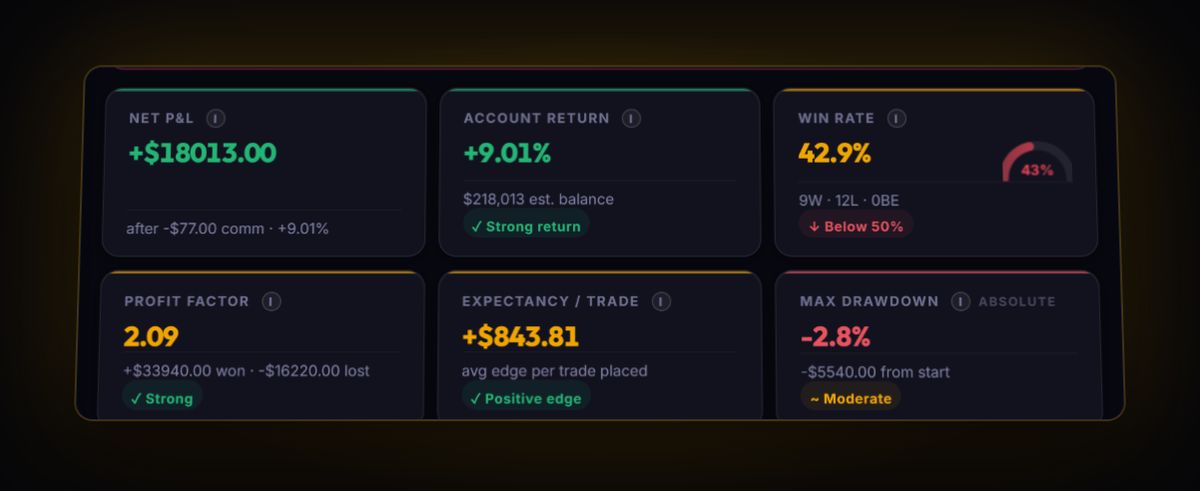
The journal computes Profit Factor as gross winning P&L ÷ gross losing P&L, shows it on the dashboard and splits it by setup in the Profit Factor by Setup panel. It also tracks Total Commission, Commission % of Gross P&L and Net P&L After Commission, so you can see how much of the ratio costs are eating.
See your own Profit Factor from real trades
Stop estimating it in a spreadsheet. Log or sync your trades and the journal keeps the number current after every close.
Start free, no card