The 50/200 EMA trend filter: when to add, hold or step aside
Compare three things on a daily or weekly chart: the price, the 50-period EMA and the 200-period EMA. Price above a rising 50 EMA, which is above the 200 EMA, is an uptrend, and adds are allowed. Price below the 50 EMA but above the 200 EMA is a pullback: hold, and only add at levels you planned. When the 50 EMA falls below the 200 EMA, stop adding and reread the thesis. That is the whole filter.
Last checked: 8 October 2026. Education only, not personal investment advice.
A trend filter does not tell you what to buy. It tells you when your buying is swimming with the current and when it is swimming against it. For a long-term investor that alone is worth a lot, because the largest losses in a portfolio usually come from adding to a stock all the way down a falling trend.
Why exponential, not simple
We use exponential moving averages throughout. An EMA gives more weight to recent prices, so it turns sooner when a trend changes. A simple average treats a price from 200 days ago the same as yesterday’s, which is why it lags at exactly the moments you most want to know.
The formula is short:
k     = 2 / (N + 1)
EMA = price × k + previous EMA × (1 − k)For the 50 EMA, k = 2 ÷ 51 = 0.0392. For the 200 EMA, k = 2 ÷ 201 = 0.00995.
Yesterday both EMAs were at $100.00. Today the stock closes at $108.00, an 8% jump.
New 50 EMA: 108 × 0.0392 + 100 × 0.9608 = $100.31. New 200 EMA: 108 × 0.00995 + 100 × 0.99005 = $100.08.
One big day barely moves either line, and moves the 200 about a quarter as much as the 50. That is what you want from a filter: it ignores a single headline and responds to weeks of behaviour.
The three states, with numbers
| State | Example | What you do |
|---|---|---|
| Uptrend | Price $142, 50 EMA $135, 200 EMA $120 | Hold. New money and planned adds allowed. |
| Pullback | Price $128, 50 EMA $133, 200 EMA $124 | Hold. Add only at levels written down in advance. |
| Downtrend | Price $112, 50 EMA $118, 200 EMA $121 | No new buys. Reread the thesis. Check your invalidation level. |
The downtrend row is not an automatic sell. If your thesis is intact and your invalidation level has not been hit, you can keep holding. What changes is that you stop putting new money in until the trend repairs.
A second check: how stretched is it?
Distance from the 200 EMA tells you how far the price has run ahead of its long-term trend. Work it out as (price ÷ 200 EMA − 1) × 100.
Price $168, 200 EMA $120: (168 ÷ 120 − 1) × 100 = 40% above the trend.
The trend filter says "uptrend, adds allowed". The stretch says an add here buys at a price that would need to fall 28.6% just to touch the 200 EMA. For a position sized off a stop near the 200 EMA, that is a very wide stop and a very small position. Many investors set a personal ceiling, for example no new adds when price is more than 25% above the 200 EMA. Pick a number and write it down. Then record in your journal whether waiting helped.
Daily or weekly chart?
For holdings you plan to keep for years, the weekly chart is calmer: the 50-week and 200-week EMAs cover roughly one and four years of history. For positions you expect to hold for a few months, the daily chart reacts faster. Choose one per holding and note it in the journal entry, because mixing them is how a filter quietly becomes whatever you want it to say that day.
What the filter will not do
- It will not catch the bottom. By design, it says "stop adding" late in a decline and "trend is back" after some of the recovery.
- It will chop in sideways markets. When the two EMAs are flat and close together, the state flips often. Treat a flat, tangled pair as "no trend" and fall back on your planned levels.
- It does not replace the thesis. A business can break while the chart still looks fine for months.
Track the filter in your journal
The only way to know whether the filter helps you is to record the trend state at every buy and compare the results later.
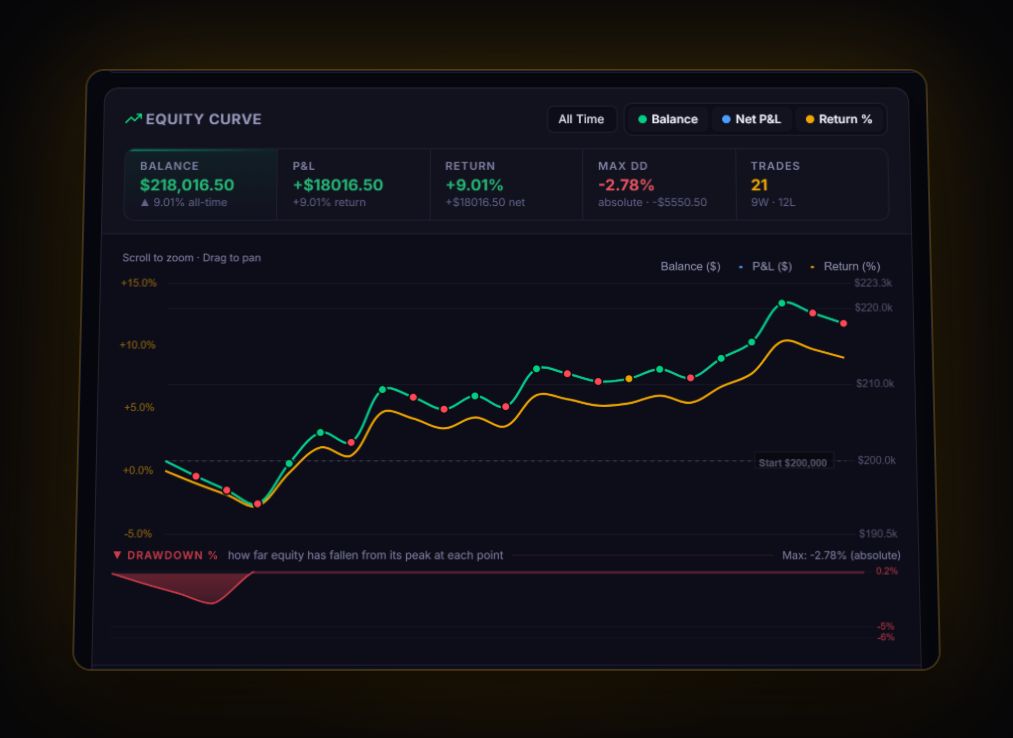
- Tag each entry with its state: "Uptrend", "Pullback" or "Below 200". In the RB Trading journal these go in the strategy field, so you can filter your results by tag and compare average R across the three groups after twenty or thirty entries.
- Screenshot the chart at entry with both EMAs visible and attach it to the trade, so the review is about what you saw, not what you remember.
- Test it on history. The journal’s AI strategy backtest lets you describe a rule in plain English and suggests variants, including adding or removing a 200 EMA trend filter, so you can compare the same idea with and without it.
Trend filter questions
Why use the 50 and 200 EMA instead of the simple moving average?
An EMA weights recent prices more heavily, so it reacts sooner when a trend turns. A simple average gives a price from months ago the same weight as yesterday, so it lags more.
Should I sell when the 50 EMA crosses below the 200 EMA?
Not automatically. Treat it as a signal to stop adding and to reread your thesis. Selling should come from your written invalidation level or a broken thesis.
Daily or weekly EMAs for long-term investing?
Weekly for holdings you plan to keep for years, daily for positions you expect to hold for months. Pick one per holding and write it in the journal entry.
Track it in a journal that does the maths
Log the trade once. R, fees and the weighted average entry are worked out for you.
Start free, no card