The formula
The break-even line is the one to watch. If your win rate sits above it you have an edge, below it you do not.
A worked example
Trader A wins 64 of 150 trades: 42.7%. Winners average 1.6R, losers 1R. Break-even is 1 ÷ 2.6 = 38.5%, so Trader A has an edge of about 4 points of win rate.
Trader B wins 72% of trades, but takes profits early (average +0.4R) and lets losers run past the stop (average −1.2R). Break-even is 1.2 ÷ 1.6 = 75%.
Trader B wins nearly three trades in four and still loses money. The fix is not "win more". It is cutting losers at the stop and letting winners reach their target.
Common mistakes
- Counting partial closes as separate wins. Close half at 1R and half at break-even and you have one trade, not one win and one scratch.
- Inconsistent break-evens. Decide once whether a $3 result counts as a win, a loss or a scratch, and stick to it.
- Chasing a high win rate. Taking profit early raises win rate and usually lowers expectancy.
- Reading it too early. Over 20 trades, a 50% strategy can easily show 35% or 65%.
How the RB journal tracks it
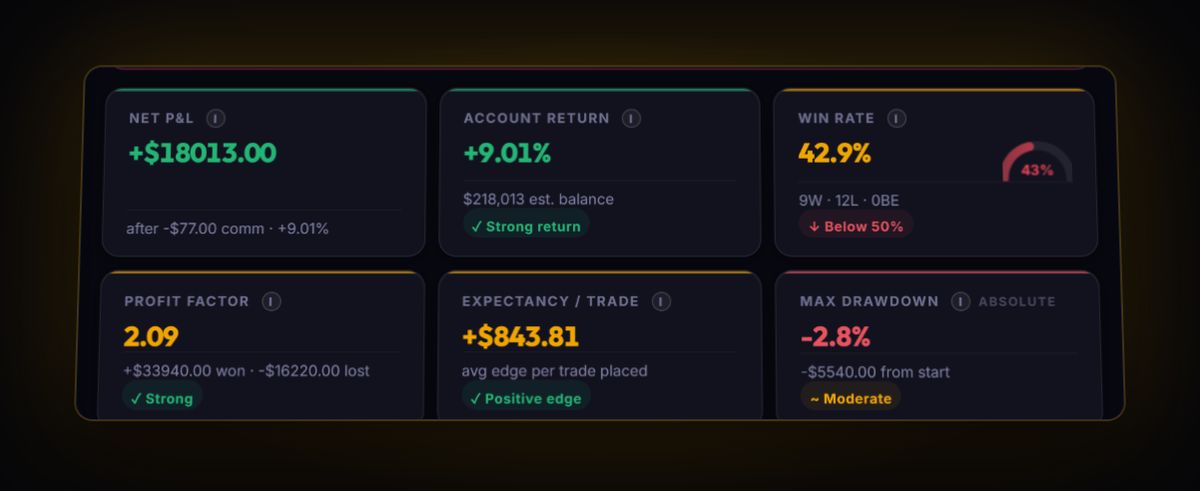
Win Rate sits on the dashboard next to Avg Win R and Avg Loss R, so you always see it with the payoff that gives it meaning. Scale-out legs are folded into one trade (on MT5 this needs EA 1.14 or later), so partial closes do not inflate the count. The journal also tracks win and loss streaks and your Max Consecutive Losses.
See your own Win Rate from real trades
Log trades by hand, import a file, or live-sync MT4, MT5 and cTrader through the RBSync EA. The numbers on this page then come from your own history instead of examples.
Start free, no card