Day trading journal: find the hour and the trade where your day turns
Ask a day trader what went wrong last month and the answer is usually a story about one bad trade. The journal usually tells a different story: the damage came from a particular time of day, from size that crept up after a loss, or from the fourth and fifth trades on days that should have ended after the second. Those three things, time, size and trade count, are the columns most day traders skip. They are also the ones that change results fastest.
Three columns most day traders skip
The exact time, to the minute
Not just the date. Your edge at the open is not the same edge at 12:30, and the only way to see that is a time stamp on the entry and the exit. With both you also get hold time, which tells you whether you are cutting winners and sitting in losers.
Size compared with your normal
Log size as a plain number, then glance at it relative to your usual. A trader who normally risks 0.5% and takes 1.5% after a red morning is no longer running the same strategy. Writing it down is often enough to stop it.
The trade number of the day
Was this your first trade, your third, your seventh? This one column answers the overtrading question better than any rule of thumb, because it shows where your own results turn negative.
A worked month, cut two ways
Example numbers, not a real account
Here is a 20-day month with 68 trades. Taken as a whole it made +1.0R. That looks like a break-even trader with a small edge. Now cut the same trades by their place in the day:
| Trade of the day | Trades | Win rate | Avg R | Total R |
|---|---|---|---|---|
| 1st | 20 | 55% | +0.45 | +9.0 |
| 2nd | 18 | 50% | +0.20 | +3.6 |
| 3rd | 14 | 36% | -0.20 | -2.8 |
| 4th and later | 16 | 25% | -0.55 | -8.8 |
The first two trades of each day made +12.6R. Everything after that gave back 11.6R. A simple rule, two trades a day and then close the platform, would have turned a flat month into a strong one while taking fewer trades. That rule came from the trader's own data, which is why it is far easier to keep than a number borrowed from someone else.
Cut the same 68 trades by time of day (New York time) and a second leak appears:
| Window | Total R |
|---|---|
| 09:30 to 10:30 | +7.5 |
| 10:30 to 12:00 | +1.0 |
| 12:00 to 14:00 | -6.0 |
| 14:00 to 16:00 | -1.5 |
The lunch hours did most of the harm. The two findings overlap, of course: late trades of the day tend to be midday trades. Either cut points to the same fix, which is to trade the first hour and a half and protect what it gives you.
What the size column adds
Example numbers, not a real account
One more cut of the same month. On 14 of the 20 days the trader kept risk at their normal 0.5% on every trade. On the other 6, after a losing first trade, they doubled to 1% to win it back. Those 6 days hold 9 of the 16 trades taken fourth or later, and because the size was doubled, every R lost on them cost twice the money. In R, that damage looks like part of the late-trade problem. In dollars, it is the biggest single leak of the month.
That is why size needs its own column. R deliberately ignores size, which makes it the right unit for judging setups. Money shows what the size changes did to the account. Look at both, and when they disagree, the size column usually holds the explanation.
The day trading metrics worth tracking
- Expectancy in R. Average R per trade, the number that says whether more trades help or hurt.
- Result by trade number and by hour, as above.
- P&L by weekday. Some traders lose most of their month on Mondays or on Fridays.
- Hold time, winners against losers. If losers last three times longer than winners, stops are being hoped on.
- Largest loss against average win. One outsized loss can erase a week of good trades.
- Win rate with average R, never on its own.
- Commission share of gross P&L. High frequency means fees matter.
How overtrading shows up in the data
Overtrading rarely feels like overtrading while it is happening. It feels like being active. In the journal it leaves clear marks:
- Trade count climbs on red days and stays flat on green ones.
- The gap between a loss and the next entry shrinks to a few minutes.
- Size goes up on the trade right after a loss.
- Trades you tag with an emotion like revenge or boredom have a clearly worse average R than the rest.
If two or more of those show up together, read our guide on how to stop revenge trading. Then set a hard limit for the number of trades and the money you can lose in a day, and let a tool enforce it rather than your willpower. The risk of ruin calculator shows how quickly loose daily limits compound.
How the RB journal handles day trading
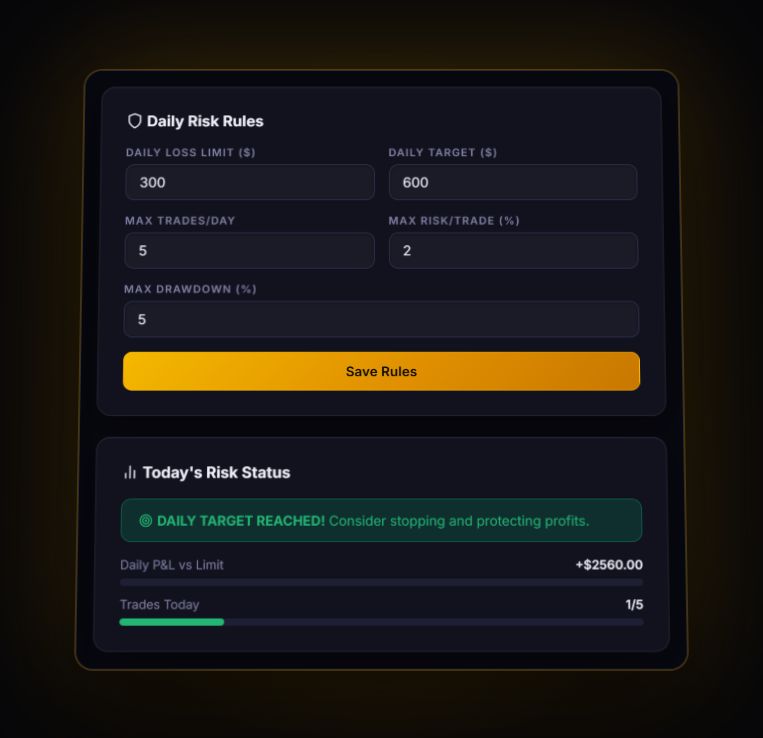
Everything above is built in, so you log the trade and the cuts appear on their own:
- Time views. A time of day heatmap, P&L by day of week and results by session.
- Risk Manager. Set a maximum number of trades a day and a daily loss limit. A live meter tracks today's loss against the limit, and the journal flags the day once you hit your trade cap.
- Emotion tags. Tag trades with states such as Overtrading or Revenge, then filter your analytics by tag.
- Hold time analysis for winners and losers, plus a commission share of gross P&L.
- A pre-trade checklist with a live GO or NO-GO verdict built from your entry, stop and target.
Getting trades in: MT4, MT5 and cTrader sync live through RBSync. NinjaTrader, Tradovate and Interactive Brokers files import with their own parsers, and other brokers go through the generic CSV mapper. The broker guides list the export steps, and you can see how we compare with Tradervue or TraderSync.
Quick answers
What should a day trading journal include?
The entry and exit time to the minute, size, stop, result in R, the trade's number within the day, a setup tag and an emotion tag. Time, size and trade count are the columns that explain most day trading results.
How many trades a day is overtrading?
There is no universal number. Group your own trades by their place in the day and look for where average R turns negative. That point is your limit.
What is the best time of day to day trade?
The one your own data says. A time of day heatmap of your results in R shows which windows pay you and which cost you, and it often differs from the hours you enjoy most.
Find the trade where your day turns
Log or import a month of trades and the hour and trade count cuts appear on their own. The free plan holds 50 trades.
Start free, no card