Stock trading journal: shares, earnings and the R behind every position
Stock traders size in shares, and that is where most stock journals go quiet. They record the ticker, the price and the profit, but not whether the position risked what you meant it to. A useful stock trading journal starts with four numbers per trade: shares, stop, dollar risk and the result in R. Add a tag for trades held through an earnings report and you can answer the two questions that matter most, whether your sizing is consistent and whether your edge survives the overnight news.
Size from the stop, not from the share price
The formula is simple: shares equal the dollars you are willing to lose divided by the distance from entry to stop. The result often surprises people, because a cheap stock with a wide stop and an expensive stock with a tight stop can need very different share counts for the same risk.
Example numbers, not a real account
A 25,000 dollar account risking 1%, so 250 dollars a trade:
| Stock | Entry | Stop | Distance | Shares | Position value | Share of account |
|---|---|---|---|---|---|---|
| Stock A | $48.20 | $46.70 | $1.50 | 166 | $8,001 | 32% |
| Stock B | $212.00 | $207.50 | $4.50 | 55 | $11,660 | 47% |
Both positions risk 250 dollars. Now imagine the habit of buying 100 shares of whatever you like. Stock A would risk 150 dollars and Stock B 450, three times as much, for no reason except the share price. A journal that logs shares, stop and dollar risk catches this the first week. The position size calculator does the sum before you place the order.
The last column matters too. Position value as a share of the account is your concentration. Two or three positions like Stock B and most of the account sits in a handful of names, which is fine if you meant it and dangerous if you did not.
Earnings: the gap your stop cannot stop
Companies usually report results outside regular trading hours, before the open or after the close. That means the price can move a long way while the market is shut, and the next open fills your stop wherever the stock starts trading. A stop limits the loss you planned, not the loss the open hands you.
Example numbers, not a real account
Take Stock A from above: 166 shares at 48.20, stop at 46.70, 250 dollars at risk. Earnings come out after the close and the stock opens the next morning at 44.10. The stop is filled near the open, 4.10 below entry, a loss of about 680 dollars. That is -2.7R on a trade planned as -1R at worst.
Earnings holds can also win big, which is why the journal should not just ban them. It should separate them. Tag every position held through a report, then compare:
| Group | Trades | Total R | Worst trade |
|---|---|---|---|
| Held through earnings | 3 | +0.8 | -2.7R |
| Closed before earnings, or no report | 11 | +4.6 | -1.1R |
Three earnings holds made +0.8R between them, with one trade at -2.7R. Eleven ordinary trades made +4.6R and never lost more than about 1R. Over a bigger sample, a split like that tells you whether earnings are part of your edge or just a source of noise. If you keep them, cut the size before the report so a gap like the one above costs 1R, not nearly three.
The stock metrics worth tracking
- R per trade and expectancy. Comparable across a 20 dollar stock and a 400 dollar one.
- Dollar risk consistency. If planned risk ranges from 100 to 600 dollars, the sizing is not a system yet. Position sizing covers the methods.
- Concentration: the largest position as a share of the account.
- Earnings holds against everything else, as above.
- Slippage at the open: the gap between the price you expected and the fill on market orders in the first minutes.
- Long against short, and by sector or setup.
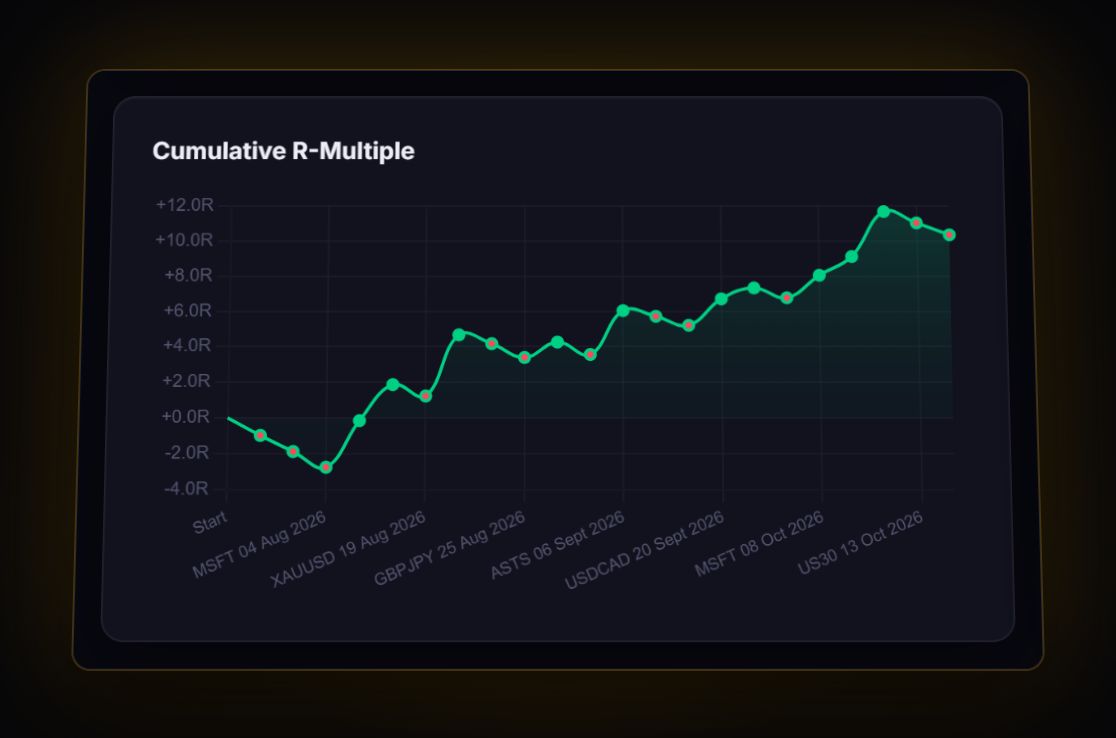
- Cumulative R, the curve that shows whether the edge is building steadily or comes from one lucky trade.
Mistakes a stock journal surfaces
Round-number sizing. 100 shares, 500 shares, a thousand dollars a position. It feels tidy and gives uneven risk, as the table above shows.
The trade that became an investment. A short-term trade goes red and is renamed a long-term hold. Tag the plan at entry. Positions that changed category mid-trade tend to show a poor average R as a group. Real long-term positions belong in their own account, and our investing guides cover how to journal those.
Averaging down without a plan. Each extra buy lowers the average price and raises the dollar risk. Log every entry so the journal can show what the position really risked.
Short costs that hide. Borrow fees on hard-to-borrow stocks are charged while you hold the short. Record them, or short results look better than they were.
Chasing the opening gap. A stock that gaps up on news looks like momentum, and a market order in the first minute fills wherever the spread happens to be. Tag those entries and compare their fills and average R with entries taken after the first fifteen minutes. If the early fills are consistently worse, the fix is a time rule, not a new scanner.
How the RB journal handles stocks
Interactive Brokers has its own parser: it reads the Trades section of the activity statement, pairs fills first in, first out, and keeps IBKR's realised P&L and commission. thinkorswim, Webull, Robinhood, Fidelity and other US brokers come in as CSV: a file with side, quantity and price columns is read as fills and paired into round trips per symbol. There is no live sync for stock brokers; live sync covers MT4, MT5 and cTrader.
Size is stored per trade in shares, the built-in position size calculator works from your stop distance, and every trade's R feeds the cumulative R curve and the full statistics panel. Free-text tags let you mark earnings holds, setups or sectors and then filter the analytics by them. Positions you build in several buys can be logged as split entries of one trade. Export guides with the exact menu paths are on the pages for Interactive Brokers, thinkorswim and Webull. To see how a run of results like yours could play out, try the Monte Carlo simulator, and if you are choosing a tool, here is our Tradervue comparison.
Quick answers
How many shares should I buy on a stock trade?
Divide the dollars you are willing to lose by the distance from your entry to your stop. With 250 dollars of risk and a 1.50 stop distance, that is 166 shares. The share price itself does not decide the size.
Should I hold stock trades through earnings?
Only if your own journal says it pays. Tag every trade held through a report and compare its R with the rest. Because earnings gaps can jump a stop, many traders cut size before the report.
Can I import stock trades from Interactive Brokers or thinkorswim?
Yes. Interactive Brokers activity statements have their own parser. thinkorswim, Webull and most other US brokers import as CSV, where buys and sells are paired into trades first in, first out. There is no live sync for stock brokers.
Every position, measured in R
Import your IBKR or thinkorswim history and see your sizing and earnings holds side by side. The free plan holds 50 trades.
Start free, no card