Swing trading journal: what happens while you are not watching
A swing trade spends most of its life with the screen off. It sits through closes, overnight sessions and weekends, and the things that decide its result happen in that time: a gap at the open, the financing charged every night, the run in your favour that you never saw because you were asleep. A swing trading journal has to capture that hidden part. Record how long you held, how many nights and weekends, the gap at each open that mattered, the swap or financing, and the best and worst prices during the trade.
What a swing journal adds to a normal one
- Holding period in days, and how many weekends the trade sat through.
- Gaps. Where the market opened compared with the prior close, and above all compared with your stop. A stop is an instruction, not a guarantee. If price opens beyond it, you are filled at the open.
- Planned stop against actual fill. The difference is your gap slippage, and over a year it can be bigger than your commissions.
- Swap or financing, per trade and in total. On CFDs and forex it is charged each night the position is open.
- MFE and MAE: the furthest the trade went for you and against you before it closed.
- The higher timeframe reason, for example price above the 50 EMA on the daily chart, so you can later test whether the filter helps.
- Management events: a partial exit, the stop moved to break even, a trail started.
One swing trade, walked through
Example numbers, not a real account
A 50,000 USD account risks 1%, so 500 USD. The trade is long 0.50 lots of GBPUSD at 1.2700 with a stop at 1.2600, which is 100 pips. At about 10 USD per pip per standard lot, 0.50 lots is 5 USD a pip, so the stop risks exactly 500 USD. The target is 1.2950, or 2.5R.
| What happened | Detail |
|---|---|
| Worst point (MAE) | 1.2640, 60 pips against, on day two |
| Monday open | Gapped 25 pips lower than Friday's close, still well above the stop |
| Best point (MFE) | 1.2880, 180 pips in favour, on day seven |
| Exit | Trailed stop hit at 1.2810, +110 pips, +550 USD gross |
| Swap | Nine nights charged at an example 3.10 USD a night, 27.90 USD |
| Result | +522.10 USD net, +1.04R |
A winner, but the journal asks three useful questions. First, the trade captured 110 of a possible 180 pips, about 61% of the move. Is that typical for you, or did the trail sit too tight? Second, the worst point was 60 pips against a 100 pip stop. If your winners rarely go more than 60 pips against you, a tighter stop would allow a bigger size for the same 500 USD risk. Third, financing took about 5% of the gross. Small here, but it doubles on a trade held twice as long.
Review by holding period
Once you have twenty or thirty swing trades, group them by how long you held them. This is one of the most revealing cuts a swing trader can make.
Example numbers, not a real account
| Held | Trades | Avg R | Swap paid |
|---|---|---|---|
| 1 to 3 days | 9 | +0.10 | $21 |
| 4 to 10 days | 12 | +0.90 | $168 |
| 11 days or more | 5 | -0.40 | $212 |
In this example the middle bucket does all the work. The longest holds pay the most financing and earn the least, which usually means one of two things: trades that should have been cut were left to drift, or targets were too far for the setup. Very short holds barely beat zero, which hints at exits taken out of nerves. A rule like "review any trade still open after ten days" comes straight out of a table like this.
The swing metrics worth watching
- MFE capture: how much of the best open profit you actually kept. Read the MFE and MAE entries for the maths.
- MAE on winners against your stop distance, to see whether stops are wider than the trades need.
- Average hold of winners against losers. Swing traders who hold losers longest are often hoping, not managing.
- Gap losses: trades filled beyond the stop, and how much it cost.
- Financing as a share of gross profit.
- R by holding period, as above, and by whether the trade was held over a weekend.
Mistakes a swing journal exposes
The day trade that became a swing. It was meant to close by the end of the session, it went red, and it was kept "for a bounce". Tag the original plan on every trade and these show up as a group with a poor average R.
Stops sitting where a gap jumps them. A stop just under an obvious level is the first one a weekend gap skips. Gap losses that keep repeating mean the stop or the size needs to change before Friday.
Cutting winners because the screen is open. Low MFE capture often comes from checking the chart too often. Some traders improve simply by setting the trail and closing the platform.
Adding to a loser. Scaling in is a plan; averaging down is a reaction. If you scale, log each entry. Our guide on tracking a position you scale into shows how.
How the RB journal handles swing trades
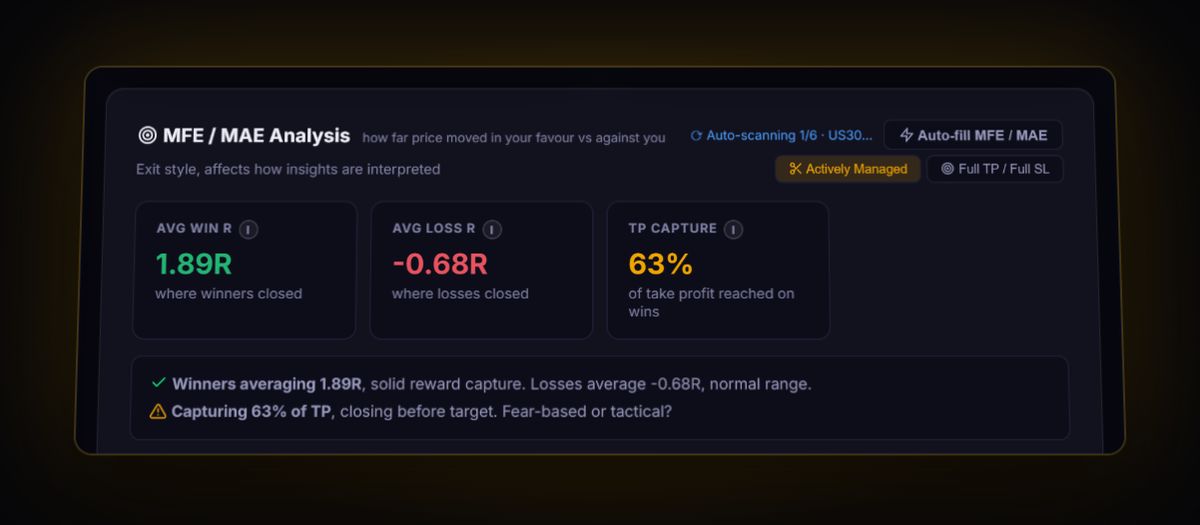
Each trade carries a swap and overnight field, which RBSync fills automatically for MT4, MT5 and cTrader accounts, and you can type it in for anything imported by file. Log a close date and the hold time analysis compares winners with losers. The MFE and MAE analysis shows where trades closed against their best and worst points, and the journal can fill those values from price data. Partial exits are tracked as banked profit on trades that are still open, and each trade has room for notes and a chart screenshot so you remember why you held it. For positions you add to over time, the journal records split entries as one trade. If you build longer holds around moving averages, the 50 and 200 EMA trend filter guide pairs well with this page.
Before you hold through a weekend on a prop account, check the firm's rules: some do not allow weekend holds on every account type. The prop firm rules hub has each firm's current terms. Comparing journals? Here is how we stack up against Edgewonk.
Quick answers
What should a swing trading journal track?
Days held, nights and weekends held, the gap at any open that mattered, planned stop against the actual fill, swap or financing, the best and worst price during the trade (MFE and MAE) and the result in R after costs.
Should swap be included in my swing trading results?
Yes. Financing is a real cost of holding, and on longer holds it can take a noticeable share of the profit. Judge each trade on its result after swap and commission.
How do I know if my swing trades are held too long?
Group your trades by holding period and compare the average R and the financing paid in each group. If the longest holds earn the least and cost the most, set a review point for trades that run past it.
See what your holds really earn
Sync MetaTrader or cTrader so swap comes in with every trade, or import a file. The free plan holds 50 trades.
Start free, no card